Saturday, September 20, 2008

H2OMAP and InfoSWMM Sediment Transport Modeling


H2OMAP SWMM and InfoSWMM Sediment Transport Modeling

Sanitary and combined sewer systems can carry substantial loads of suspended solids (waste solids) which can accumulate and cause blockages thereby impairing the hydraulic capacity of the sewer pipes (by restricting their flow area and increasing the bed friction resistance). H2OMAP SWMM and InfoSWMM can simulate the transport and gravitational settling of (total suspended solids including grit) over time throughout the sewer collection system under varying hydraulic conditions. As long as flow velocity exceeds the critical/terminal velocity, H2OMAP SWMM and InfoSWMM assumes that the sewage flow has the capacity to transport all incoming . Deposited  particles are also assumed to be scoured and transported downstream when velocity of the sewage flow exceeds the terminal velocity. Settling starts when flow velocity falls below the critical velocity. In the model, transport of thet particles is governed by advection implying that the particles are transported at local flow velocity. 

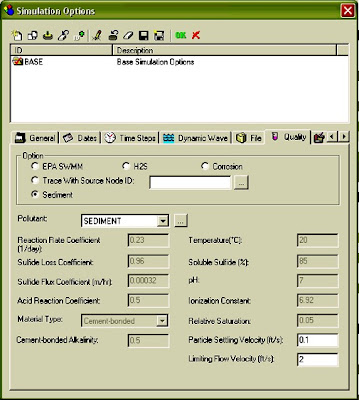
The sediment transport modeling using H2OMAP SWMM and InfoSWMM  requires only few inputs, namely limiting flow velocity, particle settling velocity, and source node(s) and initial concentrations (in mg/l) at the source nodes. 

In order to specify the first two inputs (i.e., limiting flow velocity and particle settling velocity), the user should first select from the quality tab which in turn activates the editing tabs for particle settling velocity and limiting flow velocity. Specification of source node(s) and its/their initial concentration is similar to the method described above in relation to pollutant transport. The default values used by the model for limiting flow velocity and particle settling velocity are 2 ft/s and 0.1 ft/s, respectively.  User specified values over rid these default figures .
H2OMAP SWMM and InfoSWMM  deposition (in kg)  in pipes and  concentration (in mg/l) at manholes,  wet wells, and outlets are the outputs reported following successful simulation of  transport for a collection system.


Modified Basket Handle Cross Section Warnings

There is a rule in SWMM 5 that the depth cannot be less than half the bottom width for a modified basket handle(see below).  You always have to have a maximum depth less than 50 percent or 1/1 of the bottom width,  If you do not meet this criterion then the program will generate an invalid number warning.  This is the code from xsect.c that checks the validity of the cross section data:

    case MOD_BASKET:
        if ( p[1] <= 0.0 || p[0] <>
        xsect->yFull = p[0]/ucf;
        xsect->wMax  = p[1]/ucf;

Saturday, September 13, 2008

Wave Of Sewage Flows Toward Tampa Bay

Wave Of Sewage Flows Toward Bay

Tribune photo by CANDACE C. MUNDY
Workers with Spectrum Underground Inc. work to repair a 20-inch sewage pipeline which broke in Town 'N Country this afternoon.
Published: September 13, 2008
TOWN 'N COUNTRY - Approximately 200,000 gallons of untreated sewage spilled into Sweetwater Creek on Friday afternoon, prompting a warning to residents along the creek to avoid the water, Hillsborough County officials said.
The spill occurred along Comanche Avenue just east of Hanley Road when a 20-inch sewage pipeline ruptured. The break was at a connection point to a section that had been replaced about eight weeks ago, officials said.
Because the work had been done so recently, it was under warranty, and the original contractor returned to fix the break, said Bill Bozeman, project manager for the county's water resource services. Bozeman did not know what caused it.
The fracture, reported by a passer-by at about 12:45 p.m., caused sewage to spill onto Hanley Road and ooze down Comanche toward the creek. The flow was contained two hours later. After five hours, a cloud of sewage still fogged the water along one of the creek's banks.
The section of Comanche where the spill occurred is home to a couple of businesses and a small strip of offices under construction. A narrow bridge over Sweetwater Creek leads to a neighborhood and to Sweetwater Organic Community Farm.
The farm does not rely on the creek for irrigation and the creek in that section is too shallow and choked with overgrowth in places for kayaking or swimming. County workers posted signs in English and Spanish notifying visitors of high bacterial levels and a health risk, telling them not to swim, wade or fish in the water.
Residents along the creek, which flows south to the Courtney Campbell Parkway area, are urged not to have any contact with the water for the next several days in the creek or the area where it flows into Tampa Bay.
While the contractor worked to repair the pipe, the county diverted the flow from nearby lift stations that serve the areas into tanker trucks.
The spill did not affect home use of water, Bozeman said.
The Water Resource Services staff will notify local and state environmental agencies, take samples and monitor the area where the spill occurred.

Sunday, September 7, 2008

Manual de SWMM 5 en espanol

SWMM 5 View Variables


SWMM 5 View Variables


There are four types of graphical variables in SWMM 5: (1) Subcatchements, (2) System, (3) Nodes and (4) Links.  The SWMM 5 Hydrology binary graphics file consists of 21 view variables for each subcatcment simulation in SWMM 5.  The variables are:
    
Subcatchment Variables Description
      SUBCATCH_RAINFALL  rainfall intensity
      SUBCATCH_SNOWFALL snowfall intensity
      SUBCATCH_RUNOFF total runoff flow rate
      SUBCATCH_RUNOFF_IMPZero runoff flow rate from zero imp area feb 2007
      SUBCATCH_RUNOFF_IMP runoff flow rate from imp area feb 2007
      SUBCATCH_RUNOFF_Pervious runoff flow rate from pervious area feb 2007
      SUBCATCH_LOSSES total losses (infil)
      SUBCATCH_EVAP watershed evaporation loss
      SUBCATCH_DEPTH watershed depth
      SUBCATCH_GW_FLOW groundwater flow rate to node
      SUBCATCH_GW_FLOW_A1 groundwater flow rate to node
      SUBCATCH_GW_FLOW_A2 groundwater flow rate to node
      SUBCATCH_GW_FLOW_A3  groundwater flow rate to node
      SUBCATCH_GW_ELEV elevation of saturated gw table
      SUBCATCH_GW_THETA soil moisture
      SUBCATCH_GW_PERCOLATION aquifer deep percolation
      SUBCATCH_SNOWMELT watershed snow melt
      SUBCATCH_SNOWDEPTH watershed snow depth
      SUBCATCH_FREEWATER watershed snow depth
      SUBCATCH_COLD watershed cold content
      SUBCATCH_SNOWAREA watershed snow coverage
      SUBCATCH_UL soil thickness
      SUBCATCH_FTOT infiltration during an event
      SUBCATCH_FU current value of F
      SUBCATCH_FUMAX maximum value of F
      SUBCATCH_MOISTURE current soil mositure (less than porosity)
      SUBCATCH_IMD current IMD (Porisity - Moisture)
      SUBCATCH_IMDbyEvent IMD at the beginning of an event
      SUBCATCH_SAT  Flag for saturation (1 is saturated)
      SUBCATCH_INFIL_TIME GA infiltration time
      SUBCATCH_WLMAX current infiltration RATE
      SUBCATCH_NETPRECIP rainfall intensity
      SUBCATCH_BUILDUP pollutant buildup concentration
      SUBCATCH_WASHOFF pollutant washoff concentration
The SWMM 5 system binary graphics file consists of 25 variables on one line for each system variable simulated in SWMM 5.  The variables are:
System Variables Description
SYS_TEMPERATURE air temperature                   
SYS_WINDSPEED wind speed                        
SYS_RAINFALL rainfall intensity                
SYS_SNOWFALL snow depth                        
SYS_RUNOFF runoff flow                       
SYS_LOSSES evap + infil                      
SYS_EVAP evap                              
SYS_DWFLOW dry weather inflow                
SYS_GWFLOW ground water inflow               
SYS_IIFLOW RDII inflow                       
SYS_EXFLOW external inflow                   
SYS_INFLOW total lateral inflow              
SYS_FLOODING flooding outflow                  
SYS_OUTFLOW outfall outflow                   
SYS_STORAGE storage volume                    
SYS_CE continuity error for the basin    
SYS_ITERATIONS average iterations over the basin 
SYS_SNOWDEPTH snow depth                        
SYS_COLD cold storage for the basin        
SYS_SNOWMELT snowmelt for the basin            
SYS_RAINMELT rainmelt for the basin            
SYS_TS time steps during the simulation  
SYS_DWFLoad total K3 line DWF load            
SYS_WWFLoad total K3 line WWF load            
SYS_WWFLoadExtra agency extra WWF Load             


The SWMM 5 Node graphics binary file consists of 20 variables on one line for each junction/storage/outfall/divider  simulated in SWMM 5.  The variables are:
Node Variables Description
NODE_DEPTH water depth above invert                          
NODE_HEAD hydraulic head                                    
NODE_VOLUME volume stored & ponded                            
NODE_LATFLOW lateral inflow rate                               
NODE_IIFLOW total rdii inflow rate                            
NODE_UH1 total rdii inflow rate from UH 1
NODE_UH2 total rdii inflow rate from UH 2
NODE_UH3 total rdii inflow rate from UH 3
NODE_DWFFLOW total DWF inflow rate                             
NODE_INFLOW total inflow rate                                 
NODE_OUTFLOW total outflow rate                                
NODE_OVERFLOW overflow rate                                     
NODE_CE node ce                        
NODE_AREA node surface area              
NODE_DQDH node surcharge dqdh            
NODE_DENOM node surcharge dqdh            
NODE_ITERATIONS node iterations to this time step  
NODE_TIMESTEP node iterations to this time step  
NODE_CONVERGENCE node iterations to this time step  
NODE_QUAL         concentration of each pollutant                   

Link Variables

AI Rivers of Wisdom about ICM SWMM

Here's the text "Rivers of Wisdom" formatted with one sentence per line: [Verse 1] 🌊 Beneath the ancient oak, where shadows p...