Autodesk Technologist with Information about Stormwater Management Model (SWMM) for watershed water quality, hydrology and hydraulics modelers (Note this blog is not associated with the EPA). You will find Blog Posts on the Subjects of SWMM5, ICM SWMM, ICM InfoWorks, InfoSWMM and InfoSewer.
Flushing toilets enable most Americans to make their own waste disappear as if by magic, but most would be hard-pressed to answer this simple question: When you flush, where does it go?
Septic tank owners, about 20 percent of Americans, are most likely to be able to give an accurate answer, because they’re responsible for the maintenance of their own sewage-disposal systems. A flush from one of their toilets sends wastewater to a tank buried on their property, where the waste products separate into solid and liquid layers and partially decompose. The liquid layer flows out of the tank and into a drainfield that disperses it into the soil, wherenaturally occurring microbes remove harmful bacteria, viruses, and nutrients. The solid layer stays behind in the form of sludge that must be pumped out periodically as part of routine maintenance. If the tank is properly designed and maintained, those bacteria, viruses, and nutrients stay out of groundwater and surface water that people may use for drinking water, and they never reach surface water bodies where people swim or boat.
The vast majority of the 80 percent of Americans who don’t use septic tanks are served by municipal water-treatment plants. Waste from their homes is whisked immediately off the premises, never to be seen, smelled, or considered again. Pipes carry waste from these homes to wastewater-treatment plants that, in some ways, work like a septic tank on a very large scale.
Just as in a septic tank, the solid and liquid wastes are separated first in a process known as primary treatment. Next, as in a septic tank’s drainfield, bacteria break down contaminants in a process called secondary treatment. After that, treatment with chlorine kills the remaining bacteria. Then, in some communities, special treatment technologies remove contaminants that are of special concern, such as phosphorus or nitrogen. When the process is complete, the treated waste meets regulatory standards and is released to a nearby water body—that is, if all goes well. If all doesn’t go well—perhaps the treatment plant suffers an outage or there’s more waste than the plant was designed to treat—untreated waste can be released to surface water.
As treatment plants age across the United States and as the country’s population grows, these releases are becoming more problematic, contributing to the serious surface-water problems that crop up frequently in the news. Harmful algal blooms like the one that cost Toledo, Ohio, its drinking waterlast summer, fish kills like the one recently reported off Long Island, and the much-discussed dead zone in the Gulf of Mexico are all fed by phosphorus, nitrogen, and other contaminants found in the untreated sewage that, according to EPA estimates, flows out of America’s treatment plants during the23,000 to 75,000 sanitary-sewer overflows that happen per year. The causes of these water-quality issues are complex, because the same pollutants can be washed into surface water from agricultural land, industrial sites, and fertilized lawns dotted with pet waste, but the 3 to 10 billion gallons of untreated waste released from our sewage-treatment plants per year cannot help but have an impact.Specifically, they affect the water you swim in and the water you drink.
* * *
A number of studies, including this one from 2010, have found that emergency room visits for gastrointestinal distress increase after a heavy rain. These illnesses are believed to spike after a storm because rainwater washes pathogens into lakes and rivers used for recreation and drinking water. A 2015 study published in Environmental Health Perspectives goes a step further than earlier research by pointing to a common type of municipal sewage-treatment system, combined-sewer systems, as an important factor in these illnesses.
The EPA has called overflows from combined sewer systems “the largest category of our Nation’s wastewater infrastructure that still need to be addressed,” affecting Americans in 32 states, including the District of Columbia. The agency has been working with municipal water systems to address the problem for decades and much progress has been made, but to understand why it’s taking so long, you have to consider history. You also have to consider the massive costs that come with making changes to public works that have served millions of people for more than a century.
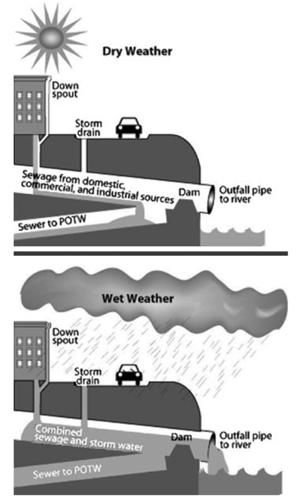
Combined sewers collect human waste, industrial waste, and stormwater runoff into a single pipe for treatment and disposal. (In other municipalities, these waste streams are handled separately.) In dry weather, a combined sewer ordinarily carries a relatively low volume of waste, delivering it to publicly owned treatment works, or POTWs for short, that are designed to handle that flow. In plain terms, when a combined sewer system is functioning properly, you can generally trust that when you flush, the contents of the toilet bowl end up where they’re supposed to go.
USEPAThings change when it rains in communities served by combined sewers. Because a combined system must handle surges of stormwater, rainfall markedly increases the volume of waste that its equipment must handle, making this type of sewage system particularly likely to overflow into surface water. As these diagramsshow, they were designed to do this as a fail-safe for system failures that were intended to be rare but aren’t any longer. If you’re accustomed to a faint smell of sewage in the streets after a rainstorm, these diagrams will show you why.
Unfortunately, the receiving waters for these rain-induced spills are sometimes the same water bodies that are used for drinking water, and sometimes people swim there, too. And sometimes the overflow is so significant that the stormwater-and-sewage mixture backs up into the streets where people walk. Is it any wonder that rainy weather often triggers a spike in stomach bugs and beach closures?
* * *
Given what’s at stake, why are upgrades to aging systems taking so long? Consider this map of the 772 American communities with combined-sewer systems.
Most combined systems are concentrated in the older cities of the Northeast and the Great Lakes region, but they also exist in other older cities as far-flung as Atlanta, Memphis, and San Francisco. In other words, the systems that pose risks today happen to be the ones—state-of-the-art when they were built, but not today—that are in some of the biggest cities in America, which have acombined population of approximately 40 million people.
If you’re feeling relieved to see that your hometown isn’t marked on the map, remember that fecal-coliform bacteria don’t always stay close to home. Waste spilled into the Ohio River affects everyone down the Ohio and the Mississippi, and it contributes to the ongoing woes of the Gulf of Mexico. Even if you don’t live in the Northeast, along the Ohio, in the Great Lakes region, along the Mississippi, or on the Gulf Coast, bear in mind that 40 percent of the commercial seafood caught in the continental U.S. comes from the Gulf of Mexico. In other words, when Cincinnati’s sewer system overflows into the Ohio, it intrudes into the food chain of a lot of people.
* * *
The EPA calls combined sewers “remnants of the country's early infrastructure.”The first sewers weren’t designed to handle the constant and huge stream of wastes from our toilets, because they were invented when we didn’t have any toilets. Sewers were originally built to solve the problems of cities that were flooded with their own refuse—garbage, animal manure, and human waste left in the open rather than in a privy or latrine—during every rainstorm. To prevent that flooding, the fouled stormwater was shunted out of town and into the nearest handy receptacle, which was often a lake, river, stream, or ocean.
When flush toilets became common in the mid-1800s, they were piped into these existing sewers, introducing much more human waste, as well as a large volume of water that had never been there before. In some ways, this was a design feature, not a bug, because the burst of stormwater flushed out pipes that might have otherwise gotten clogged. This flush of rainwater also diluted the waste before it hit a nearby river.
In time, though, dilution wasn’t enough to keep waterways safe and attractive, and sewage treatment plants were invented to clean up the waste stream before releasing it to water bodies. Newer cities, which were starting from scratch, generally handled stormwater separately from human and industrial wastes from the start, but cities whose sewer systems had always been combined continued to treat both waste streams together.
As the older cities grew larger, their combined-treatment systems struggled to keep up, and growing populations weren’t the only factor. Time itself exacerbated their woes. In Hoboken, for example, some sewer lines date back to the Civil War. Common sense says that pipes that have been buried for a century and a half tend to leak. Over time, they also get clogged with debris or even congealed cooking oil, resulting in narrowed pipes that overflow even more easily. When narrowed pipes are already overloaded, the added influx of stormwater when it rains becomes just too much water. Now, some cities experience overflows with less than a quarter-inch of rain, with resulting risks to human health. It is common for cities with combined-sewer systems to advise citizens to stay out of the water for days after any rainfall. And now the Environmental Health Perspectives study suggests that after a very heavy rain, those overflows may be affecting their communities’ drinking water, too.What is being done? Combined sewers have been an EPA priority for many years and, after decades of significant effort, the numbers are starting to move in the right direction, but this is not a problem that can be turned around quickly or cheaply. New York City’s combined sewers are still the single largest source of pathogens to the New York Harbor system, according to the New York Department of Environmental Protection. A single 2014 storm triggered a release into Lake Erie from Detroit, Michigan, of more than 44 million gallons of raw sewage from sanitary sewers and almost 3 billion gallons from combined sewers, and such releases from Detroit and the other cities with sewer outfalls on Lake Erie contribute to the fact that it blooms with algae every summer. Last summer, one of those algal blooms cost Toledo its drinking water for two days, and this year’s harmful algal blooms were projected to be even worse than last year’s.
As with any engineering project, the benefits of reducing overflows to zero—an effort estimated by the EPA in 2004 to cost $88.8 billion—must be weighed against its cost.
“We mustn’t forget the hugely successful effort in the 1970s and 1980s to provide secondary treatment at virtually every sewage-treatment plant in the country,” said Wayne Huber, a professor emeritus of Civil and Construction Engineering at Oregon State University. As an example, he describes what happened in Portland, Oregon, where a system of tunnels now contains 90 percent of the city’s stormwater surges. “Portland spent about $500 million on its deep tunnels and pumping system,” Huber said. “This has reduced the number of releases into the Willamette River from maybe 50 to 100 per year to five to ten per year.”
Huber also highlights Philadelphia’s “green technology” strategy to reduce overflows to the Delaware and Schuylkill rivers. Since avoiding massive construction is often synonymous with avoiding massive expenditures, Philadelphia’s use of approaches like rain gardens and green roofs to divert stormwater from the waste stream going to its treatment plants could serve as a model for other municipalities struggling with the same problems.
Huber cautions against relying on a single approach, saying that “green technology seeks to avoid large investments in infrastructure by keeping stormwater out of the combined sewer in the first place, but in heavily urbanized areas that is seldom an option, hence the massive storage projects that we see in cities like Chicago.”
On the individual level, people concerned about wastewater can give some thought to the fertilizer, pesticides, trash, and animal waste that wash off of lawns and into sewer systems, lakes, rivers, and oceans. As citizens, they can also advocate at local, state, and federal levels for improvements. People can reduce stormwater flow by planting their own rain gardens and green roofs—and by being judicious about the way they water our lawns and wash their cars. Sometimes, doing the right thing is as simple as being careful about what goes into storm drains and toilets.
After hearing about the plume of sewage, littered with used condoms and tampons, that emanated from Philadelphia’s sewer outfalls prior to the city’s upgrade, it’s hard to look at flushing the toilet the same way. If Americans want to be able to drink tap water or swim at beaches after it rains, they have to keep trying to improve wastewater infrastructure, even if the size of the problem boggles the mind. This post originally appeared on The Atlantic.
Storm water infrastructure – be it pipes, ponds, or rain gardens – is typically designed to convey or capture runoff flows associated with a design storm, the magnitude of which is based on a probability distribution of observed rainfall events (Weather and Climate 101).
One of the underlying assumptions of this design approach is that the rainfall probability distribution is static. However, recent climate trends across much of the country indicate large events are occurring with greater frequency, casting doubt on the notion of a rainfall distribution that is static in time and that storm water infrastructure designed by our current design storm approach can be expected to provide the intended level of service throughout its lifetime. Something that our community experience firsthand in April 2014 with an extreme rain event that caused catastrophic impacts to homes, businesses and roadways. Is this an indication of more things to come?
According to climate researchers from Antioch University, the upper Midwest is one area of the country where large events have been observed with greater frequency in the recent climate record. In response, the University of Minnesota has teamed with the Minnehaha Creek Watershed District, the cities of Minneapolis and Victoria, and climate researchers from Antioch University and Syntectic International to evaluate potential impacts to storm water infrastructure due to climate change. They are using the EPA Storm Water Management Models to examine the effects of a range of midcentury precipitation scenarios, derived from regionally downscaled global climate models, on the existing storm water infrastructure in two case studies: (1) a built-out residential pipe shed in South Minneapolis and (2) the growing community of Victoria located at the urban-rural fringe of the metro area.
According to climate models, the current 10-year storm by which the storm sewer network in these communities was designed is expected to increase 25 percent (5.1 inches) to 150 percent (10.1 inches) by the mid-21st century under moderate to pessimistic emissions scenario.
Using this range as rainfall input in EPA SWMM, they are seeking answers to the following questions: Can we make informed, local-scale infrastructure adaptation decisions in the midst of uncertainty surrounding long-term climate projections? How resilient is the existing storm water infrastructure to projected changes in precipitation? To what extent is flooding expected to increase in these communities? How do we predict changes in climate interact with predicted population growth and development patterns in our communities? Can storm water systems be adapted (e.g., through pipe upsizing or increasing the infiltrative capacity of the landscape through Low Impact Design/Development to provide a similar level of service under mid-21st century climate projections? What are the costs of adapting (or not adapting) storm water infrastructure? These are questions we too have been asking ourselves these last few months.
In addition to examining these questions, they have initiated a public outreach program aimed at engaging local stakeholders in community-driven adaptation planning for storm water management. They've held several workshops in Minneapolis and Victoria, and are developing a framework from which other communities can proceed with their own adaptation planning process. While the adaptive process will hold many commonalities across communities, the actual measures adopted may look very different. For instance, as indicated by their modeling for this project, adapting Minneapolis' existing storm water system to a "most-likely" mid-century precipitation scenario will require a combination of pipe upsizing, detention (likely in the form of underground storage), and infiltration. The projected costs for these upgrades ranged from $40 million to $70 million across the 1,100-acre pipe shed.
In contrast, Victoria's existing storm water network was found to be relatively resilient to projected precipitation increases; even under the most pessimistic climate scenario, excess flooding could be contained completely in streets below the curb elevation or within public open spaces such as parks and golf courses. The resiliency of Victoria's storm water system can be attributed to development policies such as buffer setbacks and wetland conservation that have acted to preserve ecosystem services related to hydrologic regulation.
The point of all this? Well, as we learned with the presentation from David Waggoner at IHMC on July 16 and at the city-county storm water symposium on July 18, we can learn from other communities on how we can implement strategies within our own community and watershed that addresses effective storm water management.
Within the last few months we have made great strides in identifying and addressing key storm water issues and concerns with the implementation of the city-county Storm Water Advisory Team and work currently being conducted by Arcadis.
We have already taken steps to address some of these issues with places like Admiral Mason Park and Corrine Jones Park. We still have work to do, but that's OK, we'll get there. Our approach needs to be multifaceted and holistic; we can't piecemeal our approach or it won't be effective. We need to look at our basins from a big picture view. If we just focus on the southern portion of the basin we will not efficiently address the issue. We start in the northern portion of basin addressing storm water before it even gets to the southern portion of the basin.
And the approach should encompass a multitude of storm water management strategies … rain gardens, pervious pavement and more.
Our initial focus should be on retrofitting and upgrades for existing, grandfathered structures, but not with just a Band-aid approach or the status quo. That no longer works, never has. Let's do things differently. Connecting with the community has been a strategy in help determining the best approach. Kudos to all those who have been involved and engaged in this endeavor; it's important for all us to have a seat at the table.
Here's some food for thought as we move forward with our storm water management issues and growth in general: Perhaps it's time that we revisit how we build (or rebuild). Through the implementation of Low Impact Design/Development we can manage storm water in a way that works better than traditional means. LID is an approach to land development (or re-development) that works with nature to manage storm water as close to its source as possible.
There are several economic and environmental benefits associated with LID.
Some of the ecological benefits include:
•The LID site planning process sets aside key natural features and focuses development into clustered patterns on the remaining land.
•The LID planning process results in housing that makes more efficient use of land and conserves critical natural features such as wetlands, vegetated buffers, and drinking water protection areas.
•The reduction of impervious surfaces reduces the amount of surface runoff and through the infiltration of storm water, recharges the groundwater system, thereby restoring the natural hydrologic cycle. This preserves groundwater supplies and base flow to streams and wetlands.
Economic benefits include:
•LID can increase property values.
•LID provides important benefits to the municipality, the developer, and the general public.
•LID reduces nonpoint source pollution.
•LID reduces demand on public storm water infrastructure.
•LID promotes recharge to and the preservation of aquifers.
•LID reduces building costs.
•LID will help considerably with addressing storm water. Improved storm water conditions means improved water quality.
We need a management strategy that sufficiently addresses historical, present, and future (potential) storm water management issues and concerns. The initial cost might be greater upfront, but it'll be worth it to protect people's homes and businesses. It's pay now or pay later. Let's do what's best for the community as a whole.
Gutierrez is executive director of Earth Ethics Inc.
The new InfoSWMM and H2OMap SWMM v13 graphics allow you to easily make 3D and 2D Bar graphs of the Process components in the model. The possible processes and the output of the processes can be seen in the Routing Continuity Output Table (Figure 1). You can make both 3D Bar Graphs (Figure 2) and 2D Bar Graphs (Figure 3) from the data an any other tabular data.
Figure 1. Continuity Flow Routing Output Table (right mouse click to see graphics options)
Figure 2. Log Scale with 3D Bar Graphs using the Continuity Flow Routing Output Table.
Figure 3. Log Scale with 2D Bar Graphs using the Continuity Flow Routing Output Table.
You can also make these Bar Graphs with the the Summary Tables (Figure 4).
Figure 4. 2D Bar Graphs for the Storage Summary Table.
-------------------------
Build 5.1.005 (4/23/2014)
-------------------------

Engine Updates:

1.  A problem with reading hydraulic results from a hot start
    file was fixed.

GUI Updates:

1.  The appearance of the Open File Dialog with preview panel
    was improved.

2.  In the property Editor for storage nodes, the Ponded Area
    property was made read-only since storage nodes are not
    allowed to pond water.

3.  Some issues with pop-up topic windows in the Help file
    being obscured by the main Help window were fixed.
I like the way the SWMM 5 solution for the St Venant Equation and the Node Continuity Equation is presented in this paper file:///D:/Downloads/swmm-paper-libre.pdf It shows the major components of the SWMM5 solution (gravity, time, inertial, friction and entrance/other and exit losses) and the connection between Storage Area of the Node and the Area of the Node associated with the connecting links. In my description of the solution here http://www.swmm5.net/2013/07/st-venant-terms-in-swmm-5-and-how-they.html dq1 is Friction, dq2 is gravity, dq3 + dq4 is inertial and dq5 is losses.
The Minimum Surface Area in SWMM 5 - Meaning and Usage The minimum surface area in SWMM 5 is intended for manholes that have a gap between the Node Invert Elevation and the Lowest Connecting Link Invert but it also has other uses in simulation. If there is a gap the minimum surface area is used to prevent a divide by a zero surface area in the node continuity equation. In the case of very short links where the area of the links added to the node surface area is less than minimum surface area then the area used is the minimum surface area. If you want the SWMM5 engine to essentially ignore the minimum surface area then set the area to a small value in the Dynamic Wave Tab of the Simulation Options Dialog (Figure 1). This applies equally to the both Manholes and Storage nodes as shown in Figure 1. The Surface area for the Storage Node is set equal to the Minimum Surface Area.
1. Storage Nodes and Manholes use the same Node Continuity Equation until the Highest Link Soffit is reached and then the Manhole uses the Surcharge Equation
2. Storage Nodes and Manholes both use the Minimum Node Surface Area
Figure 1. The Meaning of the Minimum Surface Area in SWMM 5
If you are using one of the SCS Options in InfoSWMM and H2OMap SWMM (Bullet 1 in Figure 1) then you should: 1. The CN, Time of Concentration and an optional Initial Abstraction in the Subcatchment DB Table (Bullet 2) 2. If the Initial Abstraction is zero then the default SCS Storage Equation or S = 0.2 (1000/CN - 10) 3. The losses from the Subcatchment occur the start and during the simulation (Bullet 3) and the Runoff is delayed compared to the Rainfall. 4. If you do not want to use S = 0.2 (1000/CN - 10) then a positive value based on alternatives such as S = 0.1 (1000/CN - 10) or S = 0.05 (1000/CN - 10)
Figure 1. SCS Hydrology In InfoSWMM and H2OMap SWMM
Introduction: This set of blogs uses the 1000 year rainfall/runoff/hydraulics model that you can download athttp://swmm2000.com/forum/topics/1000-year-simulation-with-rainfall-in-swmm-5 to show the inner workings of SWMM 5 and by extension InfoSWMM and H2oMap SWMM using a QA/QC version of SWMM 5 with extended graphics. I always hope that seeing the inner workings of a SWMM 5 feature helps to understand the code, sensitivity and importance of a parameter. It also helps show sometimes when a parameter is not important. In this example, the components of the total losses in SWMM 5 which are the infiltration from the pervious area and the evaporation from the impervious and pervious area are shown (Figure 1)
Discussion:The total losses (Figure 1) are:
1.The infiltration only losses from the pervious area, 2.Evaporation losses from the pervious and impervious area weighted by areal coverage 3.The total losses which are the sum of the evaporation plus infiltration losses
a.In a continuous simulation the times of infiltration only loss is less than the total losses due to the times when evaporation only is occurring from the depression storage of the Subcatchment
b. The Statistics assume an inter-event time of 0 hours to capture all of the one hour saved time increments
Figure 1. The total losses include both evaporation and infiltration for a 100 Year SWMM 5 Simulation
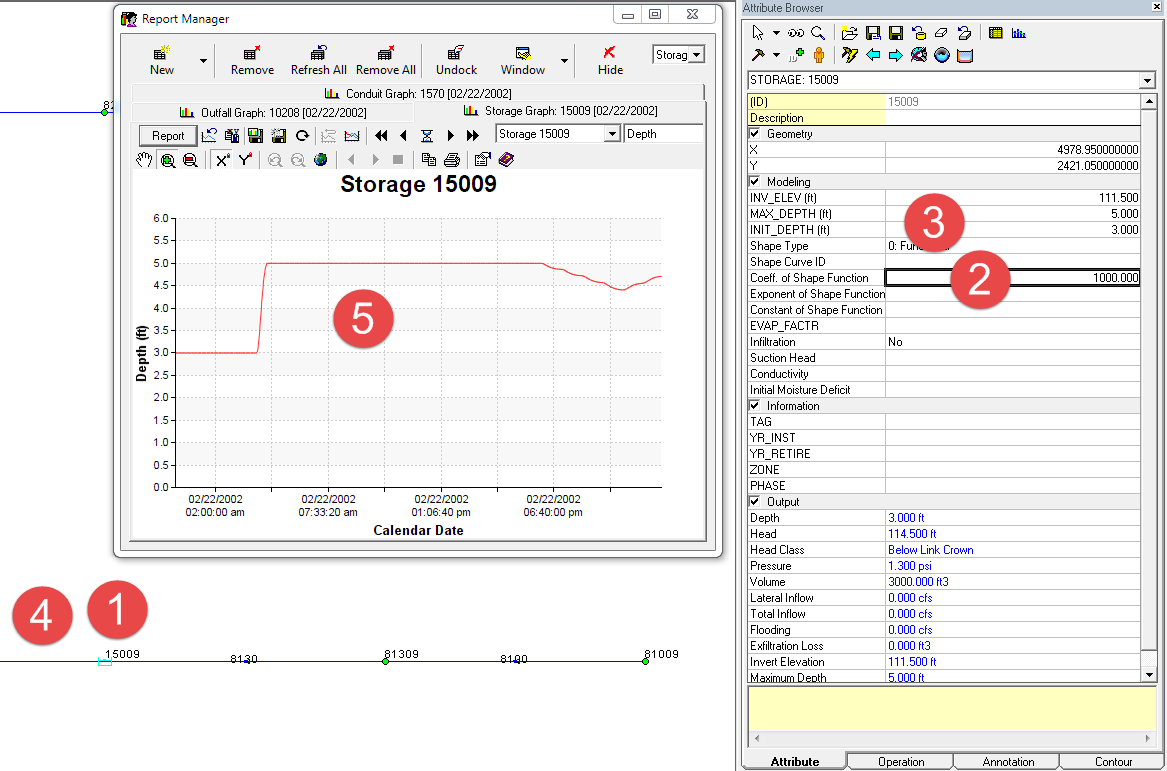
Introduction: This set of blogs uses the 1000 year rainfall/runoff/hydraulics model that you can download athttp://swmm2000.com/forum/topics/1000-year-simulation-with-rainfall-in-swmm-5 to show the inner workings of SWMM 5 and by extension InfoSWMM and H2oMap SWMM using a QA/QC version of SWMM 5 with extended graphics. I always hope that seeing the inner workings of a SWMM 5 feature helps to understand the code, sensitivity and importance of a parameter. It also helps show sometimes when a parameter is not important. Continuing with the recent blogs on Green Ampt Infiltration, you can also simulate the infiltration and evaporation from a Storage node in SWMM 5
Discussion:The infiltration and evaporation can be simulated in SWMM 5 using Green Ampt Infiltration:
1.The three Green Ampt parameters are entered in the Storage Node Dialog 2.The statistics for the whole run are shown in the Storage Node Summary Table for Volume, Percent Full and Percent Loss 3.The Node Storage Graph for Infiltration varies with the time and the depth of the storage nodes along with the side area (based on the average depth over a time step) and the bottom area of the node. In figure 2, Area0 is the bottom area and Area1 is the side area.
Figure 1. Green Ampt Infiltration for the Storage Nodes of SWMM 5 for a 100 year Simulation
Figure 2. The bottom and side area of a storage pond (Functional)
Innovyze Releases SWMMLive: Real-Time Stormwater, Wastewater and Watershed Modeling
Revolutionary New Product Equips Wastewater Utilities with Unprecedented Capabilities for Decision-Making and Real-Time Control Optimization
Broomfield, Colorado, USA, December 17, 2013
Redrawing the boundaries of collection system modeling, Innovyze, a leading global innovator of business analytics software and technologies for smart wet infrastructure, today announced the worldwide release of SWMMLive for real-time operational forecasting and management of urban drainage systems. The pioneering release provides wastewater utilities timely, accurate and reliable forecasts of what will happen within a catchment, based on past and current observations of a multitude of parameters along with future rainfall predictions. It also helps them identify flood-vulnerable assets and formulate sound remediation/mitigation strategies.
The product combines the comprehensive urban drainage modeling capabilities of InfoSWMM (and H2OMAP SWMM) with sophisticated real-time operational forecasting, early warning, and emergency management. This debut reflects Innovyze’s vanguard position in the wastewater industry and its ongoing commitment to delivering pioneering smart water solutions that enhance the safety, reliability and sustainability of the world’s hydraulic infrastructure.
Advances in computer simulation and hardware have made real-time operation of stormwater, wastewater and combined systems a reality.SWMMLive allows both large and small utilities to manage their collection systems more efficiently and effectively than ever before. This powerful risk assessment and real-time decision making tool enables managers and operators to consider the influence of a full range of catchment factors in three key areas: management of flooding and reduction of unregulated discharges; optimization of storage, green alternatives and existing infrastructure, leading to savings on capital works; and optimization of pumps to lower energy costs and reduce CO2 emissions.
SWMMLive can directly import any InfoSWMM or H2OMAP SWMM project and is designed to work automatically. Once a system is configured, real-time data is continually and automatically harvested and quality checked. This data can be defined by a number of parameters, including observed and forecasted radar rainfall, online water quality measurements, and ancillary structure and pump operation time series. Simulations are carried out automatically at a user-defined frequency using the full hydrodynamic and functional capabilities of InfoSWMM (and H2OMAP SWMM), including water quality assessment, pollution prediction, urban flooding, green LID and BMP alternatives, and real-time control. Simulation frequency can change in response to user-defined conditions. For example, increased rainfall intensity can trigger a reduction in the interval between simulations.
Warnings or alerts triggered during the forecast period are instantly displayed via the rich SWMMLive user interface, allowing system operators to see at a glance which areas need attention and what actionable options might be taken. Comparison alerts can be used to highlight differences between observed and modeled results, enabling users to refine their models — creating unprecedented confidence in simulation results.
SWMMLive also allows operators to perform additional simulations that explore alternative real time control scenarios — such as the impact of switching on a pump earlier than planned — and quickly seeing the effect of these changes on the system. The wide range of capabilities in SWMMLive allow it to be used as a key tool in the decision making process, enabling operators to take action to avoid system issues, release timely alerts, and quickly deploy response teams if necessary.
“Real-time urban drainage modeling is an invaluable tool for wastewater utility planning, engineering and water quality departments,” said Paul F. Boulos, Ph.D., BCEEM, Hon.D.WRE, Dist.D.NE, F.ASCE, President, COO and Chief Operating Officer of Innovyze. “However, translating these benefits to real-time operations has proven difficult. With SWMMLive, Innovyze has changed the paradigm for how and where urban drainage models can be applied. This milestone solution will help wastewater utilities worldwide harness the power of real-time data, scenario planning, and predictive modeling to transform the operation and management of their collection systems and anticipate and mitigate the effects of extreme weather-related events. It is the ultimate decision support system for operating and sustaining safe, reliable and efficient infrastructures while effectively protecting public health and our waterways.”
Introduction: This set of blogs uses the 1000 year rainfall/runoff/hydraulics model that you can download athttp://swmm2000.com/forum/topics/1000-year-simulation-with-rainfall-in-swmm-5 to show the inner workings of SWMM 5 and by extension InfoSWMM and H2oMap SWMM using a QA/QC version of SWMM 5 with extended graphics. I always hope that seeing the inner workings of a SWMM 5 feature helps to understand the code, sensitivity and importance of a parameter. It also helps show sometimes when a parameter is not important.
Discussion: In this blog we look at the Subcatchment Runoff Depth for the three types of Subcatchment Surfaces in SWMM 5:
1.Impervious with depression storage 2.Impervious without depression storage 3.Pervious area with depression storage
As you can see in the graphs of depth (Figure 1) the pervious depth is often zero as the infiltration is greater than the continuous rainfall. Of course this depends on the rainfall intensity, infiltration type and infiltration parameters. If you perform a Statistical Analysis on the pervious depth at a saved time step of 1 hour you will find 2721 events over a threshold of 0.01 feet.
Figure 1. Runoff from One Watershed for a 100 Year Simulation with SWMM 5 Statistics for the Subcatchment Impervious and Pervious Depth
What are the Options for LID Inflow and Outflow in SWMM 5?
The Runoff Surfaces in SWMM 5 are:
1.Pervious area with either Green Ampt, Horton or CN Infiltration 2.Impervious area without Depression Storage or Initial Losses 3.Impervious area with Depression Storage or Initial Losses
Outflow Options for the Runoff in SWMM 5 are:
1.Pervious from Impervious 2.Impervious from Pervious 3.The Subcatchment Node Outlet Or Another Subcatchment based on the Outlet Name
The LID inflow in SWMM 5 can be from:
1.The pervious area 2.The pervious area plus a fraction of the impervious area 3.The Rainfall on the LID Area 4.A LID can cover the entire Subcatchment and can get all of the Flow from another Subcatchment as well as the Rainfall on the Subcatchment
The LID outflow in SWMM 5 can be to:
1.The outlet of the Subcatchment 2.The pervious area of the Subcatchment
Note: These options also apply to InfoSWMM and H2OMap SWMM