Friday, July 26, 2013

The relationship between the rainfall, total losses from the previous area, evaporation and infiltration only rate for SWMM 5

Subject:  The relationship between the rainfalltotal losses from the previous areaevaporation and infiltration only rate.

The total loss from a subcatchment pervious area is the sum of the evaporation + infiltration loss.  Typically the evaporation rate is much less than the infiltration rateSWMM 5 now has too options – evaporation during only dry periods or evaporation during both wet and dry periods.

Figure 1:  An example network that shows the relationship between the rainfalltotal losses from the previous areaevaporation and infiltration only rate
Figure 2:  The same model with the Evaporation during only Dry Periods turned on

Making your inactive elements active in different alternative scenarios in InfoSWMM


Subject:  Making your inactive elements active in different alternative scenarios in InfoSWMM

Step 1:  Open up the Facility Manager and turn off Apply to Active Facility Only, click on Map Selection and then finally the +Add button


Step 2:  Select those elements you want to add to the Facililty (they are yellow in this case)

Step 3:  Save and then Close the Facility Manager Dialog

Step 4:  The Objects should be active now.


Step 5:  Run the Model and check if they are being used in the RPT file.


Step 6:  You can also run the Compare Scenario Command to see the different alternative models use a different set of outfalls.


Risk Assessment Manager in InfoSWMM

Subject:  Risk Assessment Manager in InfoSWMM

If you can get the Risk Assessment Manager than you can do a flooding extent based on the Maximum Head or just the Flooded Nodes.


What are the Units for the five St. Venant Flow Terms in SWMM 5 and InfoSWMM?

Subject:  What are the Units for the five StVenant Flow Terms in SWMM 5 and InfoSWMM?

The new flow (Q) calculated at during each iteration of time step as

(1)        Q for the new iteration = (Q at the Old Time Step – DQ2 + DQ3 + DQ4 ) /   ( 1.0 + DQ1 + DQ5)

In which DQ2, DQ3 and DQ4 all have units of flow (note internally SWMM 5 has units of CFS and the flows are converted to the user units in the output file, graphs and tables of SWMM 5).  

The equations and units for DQ2, DQ3 and DQ4 are:

(2)        Units of DQ2 = DT * GRAVITY * aWtd * ( H2 – H1) / Length = second * feet/second^2 * feet^2  * feet / feet = feet^3/second = CFS

(3)        Units of DQ3 = 2 * Velocity * ( aMid – aOld) * Sigma = feet/second * feet^2 = feet^3/second = CFS

(4)        Units of DQ4 = DT * Velocity * Velocity * ( aMid – aOld) * Sigma / Length = second * feet/second * feet/second * feet^2 / feet = feet^3/second = CFS


The equations and units for DQ1 and DQ5 are:

(5)        Units of DQ1 = DT * GRAVITY * (n/PHI)^2  * Velocity / Hydraulic Radius^1.333 = second * feet/second^2 * second^2 * feet^1/3 * feet/second / feet^1.33 = Dimensionless

(6)        Units of DQ5 = K * Q / Area / 2 / Length * DT = feet^3/second * 1/feet^2 * 1/feet * second = Dimensionless

The five components calculated at the each time step and at each iteration during a time step and together predict the new Link Flow (Q) in SWMM 5.  The value of the different components can be seen over time in Figure 1 and as a component percentage in Figure 2 and 3.

Figure 1:  The Five StVenant Components over time.

Figure 2:  The relative magnitude of the St Venant terms over time for the same for the same link as in Figure 1.


Figure 3:  The relative magnitude of the St Venant terms over time for the same for the same link as in Figure 1 shown in an area chart normalized to 100 percent.  Normally the DQ1 and DQ2 terms balance each other except for backwater conditions or reverse flow in which the terms DQ3 and DQ4 can dominate.


How to use SWMM 5 DOS to make an Output Table in the RPT file

Subject:   How to use SWMM 5 DOS to make an Output Table in the RPT file

You can make tables of the node,  link  and  Subcatchment output data in SWMM 5 if you use the DOS SWMM 5 program but not the Windows DLL.   Step 1 is to create the DOS batch fileStep 2 is to select the nodes, links and subcatchments, Step 3 is to run the batch file and Step 4 is to view the RPT tables or extract the data to Excel.  You can do this directly in the InfoSWMM and H2OMAP SWMM graphical user interfaces by using Run Manager, Step 5 to select the nodes, links and subcatchments andStep 6 to view the tables in the browser.

Step 1.   Make a Batch File to call the DOS SWMM 5

swmm5.exe Example1.inp  D:\swmm5.0.022\bob.rpt
pause

Step 2.  Add the nodes,  links and  subcatchments tables you want to generate in the RPT file


[REPORT]
CONTROLS         NO
LINKS                 ALL
NODES               ALL
SUBCATCHMENTS ALL

Step 3.  Run the Batch file


Step 4.  Extract the Tables from the RPT File of SWMM 5


  <<< Node 17 >>>
  ---------------------------------------------------------------------------------
                           Inflow  Flooding     Depth      Head       TSS      Lead
  Date        Time            CFS       CFS      feet      feet      MG/L      UG/L
  ---------------------------------------------------------------------------------
  JAN-01-1998 01:00:00      0.000     0.000     0.000   980.000     0.000     0.000
  JAN-01-1998 02:00:00      5.910     0.000     0.608   980.608    26.065     5.213
  JAN-01-1998 03:00:00     11.935     0.000     0.887   980.887    22.826     4.565
  JAN-01-1998 04:00:00     18.291     0.000     1.143   981.143    21.176     4.235
  JAN-01-1998 05:00:00     12.640     0.000     0.916   980.916    22.426     4.485
  JAN-01-1998 06:00:00      3.925     0.000     0.493   980.493    27.578     5.516
  JAN-01-1998 07:00:00      0.388     0.000     0.161   980.161    38.134     7.627
  JAN-01-1998 08:00:00      0.067     0.000     0.071   980.071    26.937     5.387
  JAN-01-1998 09:00:00      0.029     0.000     0.048   980.048     1.878     0.376

Step 5.  InfoSWMM and H2OMAP SWMM dialog for selecting nodes, links and subcatchments for generating a detailed RPT filetable.


Step 6.  Sample InfoSWMM and H2OMAP SWMM RPT Tables if Report Options is used.

How is RHO computed for a Link in SWMM 5?

Subject:  How is RHO computed for a Link in SWMM 5?

SWMM 5 uses a sliding metric to calculate the cross sectional area and hydraulic radius used in the simulation for the link dynamic flow.  The area and hydraulic radius used moves from the Upstream End of the Link to the Midpoint of the Link based on the Froude number and a few other considerations (see Figure 1 for the other considerations).

The area and hydraulic radius used as a function of the Froude Number:

1.   Upstream cross sectional area and upstream hydraulic radius is used when the Froude Number > 1
2.   Midpoint sectional area and hydraulic radius is used then the Froude Number is < 0.5
3.   An area and hydraulic radius between the upstream and midpoint sections is used then the Froude Number is between 0.5 and 1


Figure 1:  How to compute RHO based on the Froude Number.
Figure 2:  The computed value of the Froude Number and the value of RHO over time.

Figure 3: Relationship between the upstream area, midpoint area and the actual area used during the simulation.

Hysteresis Effect in the Link Flow versus Depth Relationship in SWMM 5

Subject:  Hysteresis Effect in the Link Flow versus Depth Relationship in SWMM 5

You can often get a hysteresis effect for the Flow versus Depth relationship in SWMM 5 due to the five component St. Venant equation used to simulate the flows (http://swmm5.blogspot.com/2010/12/what-are-units-for-five-st-venant-flow.html) .  A hysteresis effect is having two or more flow values for the same depth value in the link. For example, this image shows how the link 8100 has a different flow for the same depth in the rising and falling limb's of the hydrograph.  This is due to the different values for the upstream and downstream head, hydraulic radius and cross sectional area during the falling and rising hydrograph, respectively.

Flow Units In InfoSWMM may be different then the Output Link Flow Units

Note:  Flow Units In InfoSWMM may be different then the Output Link Flow Units

The flows units selected in Run Manager determines the flow units of all incoming units including DWF, Inflow Time Series and other features in pump curves and other curves.  The output unit manager determines what you see when you make a graph of the link flow.  For example, you can have dry weather inflow of CFS and output units of GPM or MGD if you so request and set the correct flags in the interface.


Export from WeatherUnderground using the CSV File Export Option to InfoSWMM

Note:  Export from WeatherUnderground using the CSV File Export Option to InfoSWMM

 Weather Underground is a site that provides excellent local weather information in the form of graphs, tables and csv files. You can use the data very easily in InfoSWMM by copying from Excel to a time series in InfoSWMM. Here is the rainfall for a storm event in Tampa, Florida in September 11, 2010
Step 1: Export from WeatherUnderground using the CSV File Export Option


Step 2: The data imported from the csv file to Excel and after the text to columns tool is used looks like this in Excel. The data is now ready to be imported into InfoSWMM after the time column is adjusted to fall on even 5 minute intervals. In Excel you can use the formula @ROUND((B2)/"0:05:00",0)*"0:05:00" to round all of the time values to 5 minutes. If you do not do this step then you will have problems in InfoSWMM due to the rainfall interval not being equal to the defined raingage interval.


Step 3: You will need to format the new rounded time as a time format for import into a InfoSWMM time  series.  The time series is created in the operation tab of the attribute browser.


Step 4: Open up and make a new time series in InfoSWMM.


Step 5: Copy and then paste the date, rounded time column and rainfall column into the InfoSWMM time series columns.


 Step 6:  Make a raingage in the DB Table in InfoSWMM that will use the time series you just made.  In the case of the Weather Underground data we will use inches, intensity, a rainfall interval of 5 minutes, time series and the name of the time series.  SCF should be 1 for Snow conversion and do not need to include a Filename or Station name as we are not using an external file.


Time Step Selection in InfoSWMM and SWMM5

1st The time step you use in SWMM 5 is controlled from the top by the rainfall interval (Figure 1):

1.   All of your time steps should be less than the rainfall interval,
2.   The hydrology time step should be less than or equal to the smallest raingage rainfall interval in your network,
3.   The hydraulic time step should be less than or equal to the hydrology time step and should be based on the hydraulic needs of the your network.  Short length links, pump and weirs may require a smaller maximum hydraulic time step.

2nd The report time step controls what you see in the graphics output of SWMM 5. If you see a large difference between that you see in the graphics output and the report text file it is because you have a large difference between the report time step and the average time step used during the simulation.

Solution: If there is a large discrepancy in the graphics and report text file then the best solution is to reduce the maximum time hydraulic time step so it is closer to the average time step and also to make the report time step closer to the Maximum time step (Figure 2).

Figure 1:  Relationship between the rainfall, hydrology and hydraulic time steps.


Figure 2:  Relationship between the minimum, average and maximum simulation time steps and the report time step.


InfoSewer Flow Attenuation Sensitivity

InfoSewer Flow Attenuation Sensitivity 

The three Run manager parameters, Maximum Number of Segments, Minimum Travel Distance and the Minimum Travel Distance in InfoSewer and H2OMAP Sewer affect the shape and flow attenuation of the flow in a link.  The effect of using the flow attenuation is to reduce the peak flow and spread out the flow compared to the No Flag option (Figure 1). 

Figure 1.  Effect of the Flow Attenuation Option in infoSewer and H2OMAP Sewer

InfoSewer Inflow Control for a PUMP

InfoSewer Inflow Control for a PUMP

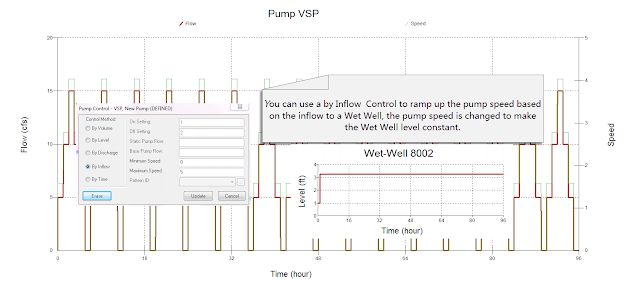
You can control the pumps in InfoSewer and H2OMap Sewer by using a Pump Control which will control the pump based on:

1.       Volume
2.      Level
3.      Discharge
4.      Inflow
5.      Time

If you use a By Inflow control the pump speed of the pump is increased or decreased to make the Upstream Wet Well Level Constant (Figure 1).
Figure 1.  Inflow Control for  PUMP in InfoSewer and H2OMAP Sewer will change the Pump Speed of the pump to make the Wet Well level constant

AI Rivers of Wisdom about ICM SWMM

Here's the text "Rivers of Wisdom" formatted with one sentence per line: [Verse 1] 🌊 Beneath the ancient oak, where shadows p...