Autodesk Technologist with Information about Stormwater Management Model (SWMM) for watershed water quality, hydrology and hydraulics modelers (Note this blog is not associated with the EPA). You will find Blog Posts on the Subjects of SWMM5, ICM SWMM, ICM InfoWorks, InfoSWMM and InfoSewer.
Friday, April 22, 2011
Node Ground Elevation in InfoSWMM
The ground elevation is listed in the Junction Hydraulic Data DB Table under:
1. Max Depth if Store Absolute Junction Rim is off in Tools/Preferences/Operation or
2. Junction Rim Elevation in the same column of the DB Table if Store Absolute Junction Rim is on in Tools/Preferences/Operation
3. It is not listed in Junction Information which is designed for user extra input data.
 |
| Figure 1. Rim Elevation for Nodes instead of Maximum Depth |
 |
| Figure 2. Maximum Depth instead of Rim Elevation for Nodes. |
Thursday, April 21, 2011
InfoSWMM 11 (for ArcGIS 9, 10) and H20MAP SWMM v10 Updated for the new SWMM 5.0.022 Engine
EPA SWMM 5 Build 5.0.022 (04/21/11)
------------------------------------------------------
Engine Updates
1. The following fixes and updates were made to the LID module of the code (lid.c):
a. The Drain Delay time for a Rain Barrel LID is now correctly converted internally from hours to seconds.
b. The meaning of the Conductivity property of an LID's Storage layer has been changed. It is now defined as the saturated hydraulic conductivity of the native soil below the layer instead of the conductivity of the layer
itself.
c. Storage layers are now optional for Bio-Retention Cells and Permeable Pavement LIDs by allowing the layer height to be zero. One should still enter a non-zero conductivity for the layer if infiltration into native soil is allowed.
d. If the top width of the overland flow surface for an LID is zero then any excess water above the surface storage depth simply spills out instantaneously.
e. The calculation of infiltration in a Vegetative Swale was corrected so that a swale with vertical sides will produce the same results as a fully pervious subcatchment with the same dimensions, roughness, and slope.
f. The water initially stored in all LID units is now reported in the Status Report's Runoff Continuity table.
g. Error messages are now generated if the surface layer vegetation volume fraction is less than 1, if the area of all LIDs in a subcatchment is greater than the total area or if the total capture area of all LIDs is greater than the subcatchment's total impervious area.
2. Missing values for accumulation periods within an NWS rain file are now processed correctly. See rain.c.
3. A new error message (318) is now generated if a user-prepared rainfall file has its dates out of sequence.
4. Evaporation during wet time periods was including rainfall and run-on as moisture available for evaporation when it should only be the current ponded depth. See subcatch.c.
5. Curve Number infiltration was modified to use only direct precipitation, not including runon or internally routed flow, to compute an infiltration rate. See infil.h, infil.c, subcatch.c and lid.c.
6. A new error message (110) is now generated if the ground elevation of a subcatchment is less than the initial water table elevation of its groundwater aquifer. See gwater.c, err.h, and err.c.
7. A check was added to the tailwater term of the groundwater flow equation to insure that the term is zero when no tailwater depth exists. See gwater.c.
8. Checks were added to the solution of the governing groundwater mass balance equations to catch conditions where the lower zone depth is greater than the total depth or when the upper zone moisture content is greater than the porosity. See gwater.c.
9. A divide by zero error no longer occurs when computing the hydraulic radius of an empty Filled Circular pipe whose filled depth is zero. A similar error for the hydraulic radius of an empty trapezoidal channel whose bottom width was zero was also eliminated. See xsect.c.
10. The critical or normal depth adjustment made for a conduit is no longer allowed to set the depth to zero -- some small depth level is always maintained. See dynwave.c.
11. The Pump Summary Report was expanded to include number of start-ups, minimum flow, and time off both the low and high ends of the pump curve. See objects.h, link.c, stats.c, and statsrpt.c.
12. When the setting of an orifice or weir was changed to 0 (to completely block flow) the flow depth in the element wasn't being set to 0. This was only a reporting error and had no effect on the flow routing calculations. See link.c.
13. The Node Surcharge Summary in the Status Report did not report a ponded node as being surcharged. This was only a reporting error and had no effect on the flow routing calculations. See stats.c.
Monday, April 18, 2011
The Economics Of H2O
The Economics Of H2O
[R]esources that are free are wasted; there’s no incentive to learn to use them smartly; there’s no money to maintain and modernize the existing water system; there’s no incentive to reach back and protect the source of something that’s free. If it’s free, the message is that it’s unlimited.
In the U.S., we spend $21 billion a year on bottled water. We spend $29 billion maintaining our entire water system: the pipes, treatment plants, and pumps. We spend almost as much on crushable plastic bottles as we do on our most fundamental infrastructure system.
Friday, April 15, 2011
Reverse Flow in SWMM 5 during one time step
Reverse flow in a link of SWMM 5 occurs if the downstream head is greater than the upstream head. The flow calculations for the link are based on the time step head, cross sectional area(s), hydraulic radius and old time step flow of the link. The only extra criterion for the link flow is the requirement that the flow cannot reverse during one iteration but must first become zero before being allowed to be negative if the old flow was positive or positive if the old iteration flow (qLast) was negative. This calculation is done in dynwave.c using the current iteration flow, q, the last iteration flow, qLast and the sign of the current iteration flow q. The requirement prevents the flow from oscillating sign during the iterative process in a time step.
In this example, a large flow from Upnode_2 causes a high head at node Middle which causes a reverse flow up link UpPipe1 to node UpNode_1. The image show here shows the flow in Link UpPipe1
if ( q * qLast < 0.0 ) q = 0.001 * SGN(q);
Two new parameters and a modified table in InfoSWMM 11 and H2OMAP SWMM
1. Allows you to control the maximum number of iterations in the solution,
2. Controls the Stopping tolerance (internal units of feet) for node iterations, and
3. Shows not only the percent continuity error at a node but the error in million gallons (Mgal)
If you have a high continuity error or want to reduce your existing continuity error then you can increase the number of iterations or lower the stopping tolerance so that at each time step there is less continuity error.
Sunday, April 10, 2011
Iterative Hot Start File in SWMM 5
1. If the continuity error is due to the lack of a hot start file,
2. You should make the hot start file iteratively, or successively Save and Use two hot start files until the initial and final stored volume is about the same in the flow routing continuity table,
3. 1st Step: Save Hot Start File 1,
4. 2nd Step: Use Hot Start File 1 and Save Hot Start File 2
5. 3rd Step: Use Hot Start File 2 and Save Hot Start File 1 and
6. Repeat until the initial and final storage volume is about the same
Friday, April 8, 2011
InfoSWMM Map Display of Scenario Differences
You can also make a table and map of the differences between the existing and future scenario. The red in the image shows the pipes in which the flows have increased and the blue shows the pipes in which the flows have decreased between the existing and future scenarios. You make the table by
1. Making a conduit report for both scenarios at the same date/time,
2. Copy the flow in the link for all links to Excel and make a new column with the difference between the future and existing conditions,
3. Make a new column in the Conduit Information Table of InfoSWMM for real data and paste the new column from Excel into the Conduit Information Table,
4. You then can use Map Display for links and show a Map Display of the flow differences at that particular date/time for all the links.
Sunday, March 27, 2011
MWH Soft Changes Name to Innovyze
MWH Soft Changes Name to Innovyze New Name Reflects Company’s Unique Water Modeling and Management Offerings and History of Innovation | |||||
| Broomfield, Colorado USA, March 27, 2011 — MWH Soft is pleased to announce it has a new name, Innovyze. The new name and logo more accurately reflect the company’s rich history of creating innovative, technically advanced modeling and management solutions for the world’s water and wastewater communities. Historically the hydraulic modeling and management market has been led by two companies, MWH Soft and Wallingford Software. In 2009, these two companies combined to offer world-class customer support and to pioneer software tools that meet the technological needs of water and wastewater utilities and engineering organizations worldwide. “The name Innovyze brings together the best characteristics of innovation and analyze, which is represented in our combined organization. It means to introduce something new and to change, while carefully identifying key factors and possible results,” said Paul F. Boulos, Ph.D., Hon.D.WRE, F.ASCE, the company’s President and COO. “Although our name is changing, our people, products, and passion are still focused on our core mission: innovating for sustainable infrastructure.” As part of the introduction of the Innovyze name, the company has an updated website at www.innovyze.com and is hosting its first public event, the 2011 Asia Pacific Water and Sewer Systems Modelling Conference, beginning March 30 in Gold Coast, Australia. For additional information regarding the change, visit www.innovyze.com/newname. About Innovyze Innovyze is a leading global provider of wet infrastructure modeling and simulation software and professional solutions designed to meet the technological needs of water/wastewater utilities, government industries, and engineering organizations worldwide. Its clients include the majority of the largest UK, Australasia and North American cities, foremost utilities on all five continents, and ENR top-rated design firms. With unparalleled expertise and offices in North America, Europe, and Asia Pacific, the Innovyze connected portfolio of best-in-class product lines empowers thousands of engineers to competitively plan, manage, design, protect, operate and sustain highly efficient and reliable infrastructure systems, and provides an enduring platform for customer success. For more information, call Innovyze at +1 626-568-6868, or visit http://www.innovyze.com/. | |||||
Saturday, March 19, 2011
Node Time Step in SWWM 5
Friday, March 18, 2011
SWMM 5 Node Step vs Link Time Step
Normally the node time step is not important except when the pipes and nodes are dry or have a small depth and the inflow to the node is high compared to the surface area of the node.
Tuesday, February 22, 2011
Components of the global water cycle
Components of the global water cycle
Water regulates climate, predominately storing heat during the day and releasing it at night. Water in the ocean and atmosphere carry heat from the tropics to the poles. The process by which water moves around the earth, from the ocean, to the atmosphere, to the land and back to the ocean is called the water cycle.
Tuesday, February 1, 2011
How to Calculate the Freeboard of a Node in InfoSWMM/H2OMAP SWMM
The freeboard for a node in InfoSWMM/H2OMAP SWMM can be calculated with a 4 step process:
1. Copy the Node Rim Elevations from the DB Tables for Junctions to Excel,
2. Run the model and then copy the Maximum HGL from the Junction Summary output table to Excel,
3. Calculate the Freeboard in Excel as the Rim Elevation minus the Maximum HGL in Excel,
4. Create a new column called Freeboard in the Junction Information DB Table and paste the Freeboard from Excel.
You will be able to perform Map Displays or Map Queries now using the new Freeboard information column.
 |
| Figure 1. 4 Step Process to Calculate Freeboard |
Thursday, January 27, 2011
Steps in converting a Arc GIS 10 Model to a Arc GIS 9.3 Model in InfoSWMM or InfoSewer
An alternative Method
Monday, January 24, 2011
Friday, January 21, 2011
Cutoff Divider in the SWMM 5 Kinematic Wave Solution
A divider node in the SWMM 5 Kinematic Wave solution will divide the inflow to a node for two downstream links based on three criteria:
1. Cutoff Divider,
2. Tabular Divider, and
3. Weir Divider
The rule for a Cutoff Divider is that the flow up to the Cutoff Flow will flow down the undiverted link and any flow over the cutoff flow will go down the diverted link. If the total inflow to a node the current flow in the undiverted link then the extra flow will go down the diverted link even though the flow in the undiverted link is not equal to the cutoff flow.
 |
| Figure 1. How the Cutoff Divider Works in SWMM 5 |
Thursday, January 20, 2011
Adverse sloped links in SWMM 5 or InfoSWMM
 |
| Figure 1. How Adverse Sloped Links are Treated in SWMM 5. |
Monday, January 17, 2011
Sunday, January 16, 2011
Saturday, January 15, 2011
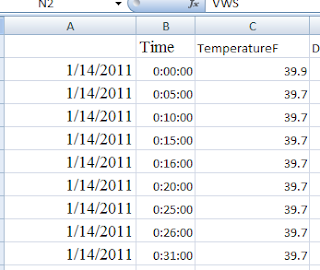
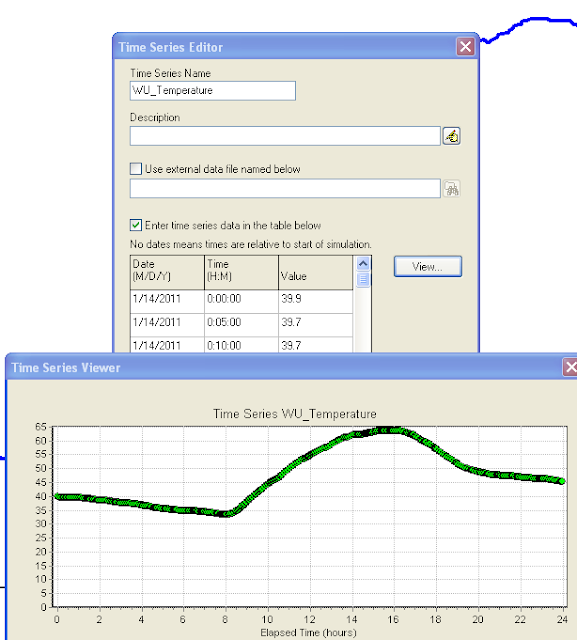
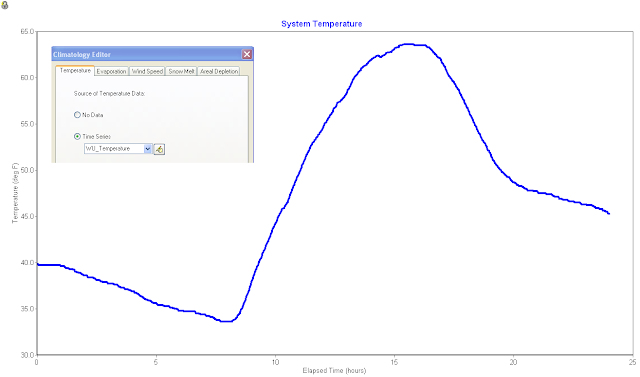
Weather Underground Temperature Data and SWMM 5
 |
| Figure 1. Weather Underground Temperature Data |
 |
| Figure 3. CSV File Exported to Excel |
 |
| Figure 4: Make a SWMM 5 Time Series to Copy and Paste the Temperature from the CSV File. |
Monday, January 10, 2011
Saturday, January 8, 2011
Types of SWMM 5 Curves
There are ten types of curves in SWMM 5.0.021 in seven categories accessible through the Data Tab and the Attribute Browser – including four types of Pump Curves:
- Storage
- Diversion
- Rating
- Tidal
- Control
- Shape
- Pump
- Pump1
- Pump2
- Pump3
- Pump4
 |
| Figure 1: Curve Types in SWMM 5 |
Types of Nodes and Links in SWMM 5 - with Emojis
Subject: 📌 Types of Nodes and Links in SWMM 5
Introduction: 🚀 SWMM 5 is a powerful tool used for simulating the hydrology and hydraulics of urban drainage systems. Central to its modeling capabilities are the nodes and links that constitute the drainage network. Let's delve deeper into understanding these critical components.
Nodes in SWMM 5 📍: Nodes are pivotal points or junctions in the drainage system where water collects and gets distributed. They can be categorized as:
Junctions 🚇: These are points where multiple links come together. They represent the convergence or divergence of flow paths. In SWMM 5, there's only one type of junction, but it plays a crucial role in defining the flow dynamics.
Storages 🛢️: Storages are areas where water is temporarily held before it's released at a controlled rate. In SWMM 5, there are three types of storage:
- Surface Storage: Represents flat areas like ponds.
- Tank Storage: Denotes vertical cylindrical tanks.
- General Storage: A more flexible form that can represent any shape.
Dividers 🚧: Dividers distribute incoming flow into multiple paths. While they can be used in the dynamic wave solution of SWMM 5, they only help divide the flow in the kinematic wave solution. There are four types of dividers in SWMM 5, each with its unique characteristics.
Outfalls 🌊: Outfalls represent points where water exits the system, either into a larger body of water or another system. SWMM 5 offers five types of outfalls, each designed to simulate different outflow conditions.
Links in SWMM 5 ⛓️: Links are the channels or pathways that connect nodes and facilitate the flow of water between them. They include:
Conduits 🚰: These are pipes or channels that transport water between nodes. They can vary in shape, size, and material.
Pumps 🔄: Pumps are devices that move water from one node to another, typically from a lower elevation to a higher one.
Orifices ⚙️: Orifices control the flow of water between nodes based on the opening size and elevation.
Weirs 🌁: Weirs are barriers that redirect or measure flow. They can be sharp-crested, broad-crested, or even compound.
Outlets 🚪: Outlets control the discharge of water from a node based on the depth or head of water.
Conclusion 🌟: Understanding nodes and links in SWMM 5 is paramount for effective modeling. These components are the building blocks of the drainage system, and their accurate representation ensures reliable and meaningful simulation results. 📊🛠️
 |
| Figure 1. Node and Link Objects in SWMM 5 |
 |
| Figure 2: Node Objects in SWMM 5 |
AI Prompt for Generating a SWMM5 inp file with Rules
Below is an example prompt you can use (in ChatGPT or any advanced language model that understands SWMM5 syntax) to generate a syntactical...
-
@Innovyze User forum where you can ask questions about our Water and Wastewater Products http://t.co/dwgCOo3fSP pic.twitter.com/R0QKG2dv...
-
Soffit Level ( pipe technology ) The top point of the inside open section of a pipe or box conduit. The soffit is the ...
-
Subject: Detention Basin Basics in SWMM 5 What are the basic elements of a detention pond in SWMM 5? They are common in our back...


.png)
.png)
.png)
.png)


.png)


